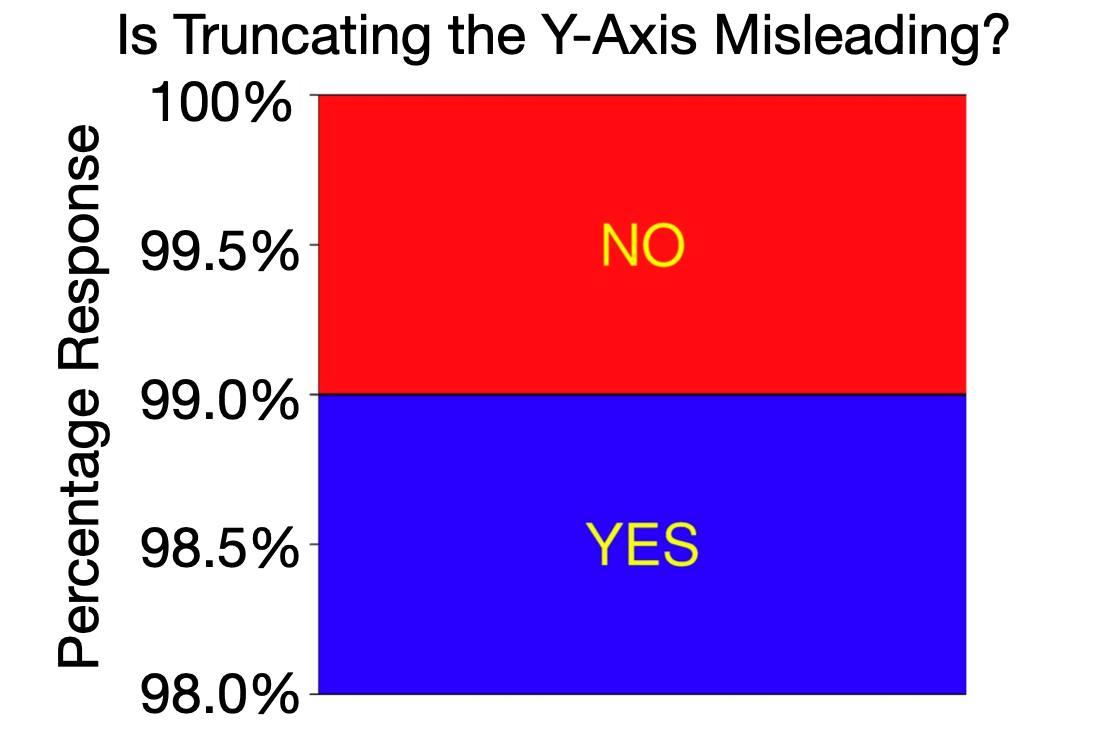
TruncatingY-AxisGraph.png |
 Open-Access Active-Learning Research Methods Course by Morton Ann Gernsbacher, PhD and Chelsea Andrews, PhD is licensed under a Creative Commons Attribution-NonCommercial 4.0 International License and based on Statistical Thinking for the 21st Century by Russell Poldrack, PhD. Permissions beyond the scope of this license may be available at https://gernsbacherlab.org Powered by WordPress & Atahualpa |
Leave a Reply